
Complementarity of tools in a market intelligence approach: example of datavisualization
Complementarity of tools: a universal principle
No tool, taken in isolation, can meet all the needs of the’ set of potential users. Each tool has strengths and limitations that make it more or less suitable for certain tasks, contexts or objectives.
It is therefore essential to combine these tools strategically, exploiting their synergies and compensating for their respective weaknesses. This approach promotes better productivity, greater adaptability and process optimization, and what’il is about cooking, building furniture, analyzing data..
The complementarity of the tools is also part of an evolving dynamic: with the constant emergence of new technologies, new tools and new methods, it becomes crucial to’ adopt a standby posture to detect these innovations, test them, and integrate them quickly and regularly in its own toolbox.
The complementarity of tools: the case of monitoring and analysis activities
In a world overflowing with information and constantly evolving, intelligence officers are faced with a major challenge: navigating the entire information management cycle, from detection to dissemination, including collection, analysis and data visualization.
To achieve this and meet the growing expectations of their organizations, such as’a more comprehensive coverage of watch topics, in-depth analysis, more selective dissemination or more attractive deliverables. They have a vested interest in knowing which optimal combination of tools to rely on in each of the steps of the’information management process.
Generalist monitoring platforms, such as Curebot, offer a broader value proposition on the’ throughout the processing cycle of’information, and play a key role in the monitoring and economic intelligence approaches. They make it possible to cover all the stages of the’information management cycle on a large majority of sources. However, they cannot meet the set of specific’ information needs you may have, nor can they replace the’ set of tools that might be useful to you.
A good craftsman needs’a good toolbox. Having a Swiss army knife is certainly practical, but it does not replace the’use of dedicated tools. The same is true for the work of’information: for each feature of’a monitoring platform, there may be specialized solutions that can offer an enriched functional coverage around a precise perimeter. Depending on the specificities of your monitoring project and your needs, it is therefore relevant to know them and know when to use them in addition to your general platform.
Let us give here some examples of’integration of solutions in the’information management cycle :
- Custom web page crawling and harvesting: There are many custom crawling services that allow you to extract very specific data and information from a set of web pages: such as ScrapingBee and Scrapy.
- Pricing data collection: If you want to monitor frequent price changes across a range of products across a set of websites, there are monitoring and benchmarking solutions available, such as Prisync and Competera.
- Expert web page monitoring: Specialized tools offer very advanced functional coverage such as ChangeTower.
- Structured data analysis: Tools like Excel, Power BI and Looker offer functional coverage of manipulation, analysis and representation that is beyond comparison with what a monitoring platform can integrate.
- Analysis of specific unstructured data: dedicated patent monitoring tools offer patent portfolio analysis capabilities, such as Questel and Matteo software which allow rapid access to large volumes of patent information.
- Visualization: Platforms like Flourish or Timeline JS offer interactive visualizations.
Depending on your needs, each tool can have its place in your monitoring and’analysis processes: their complementarity allows’ to optimize the efficiency of your activities.
The usage case : Exploiting Curebot with a datavisualization tool.
We're going to present a compelling use case involving the integration of a data visualization tool, Flourish, into a Curebot dashboard. This combination allows you to transform raw data into interactive and understandable visualizations in the blink of an eye.
This freemium tool is specifically designed to produce interactive data visualizations, offering great flexibility to customize every detail with precision. The free version allows you to create visuals from numerous templates!
Here is an example of visualizations created with Flourish, embedded in a Curebot dashboard using an iframe.
The settings are done directly on the Flourish website and can vary depending on the type of visualization chosen. We can customize almost every visual aspect according to our preferences.
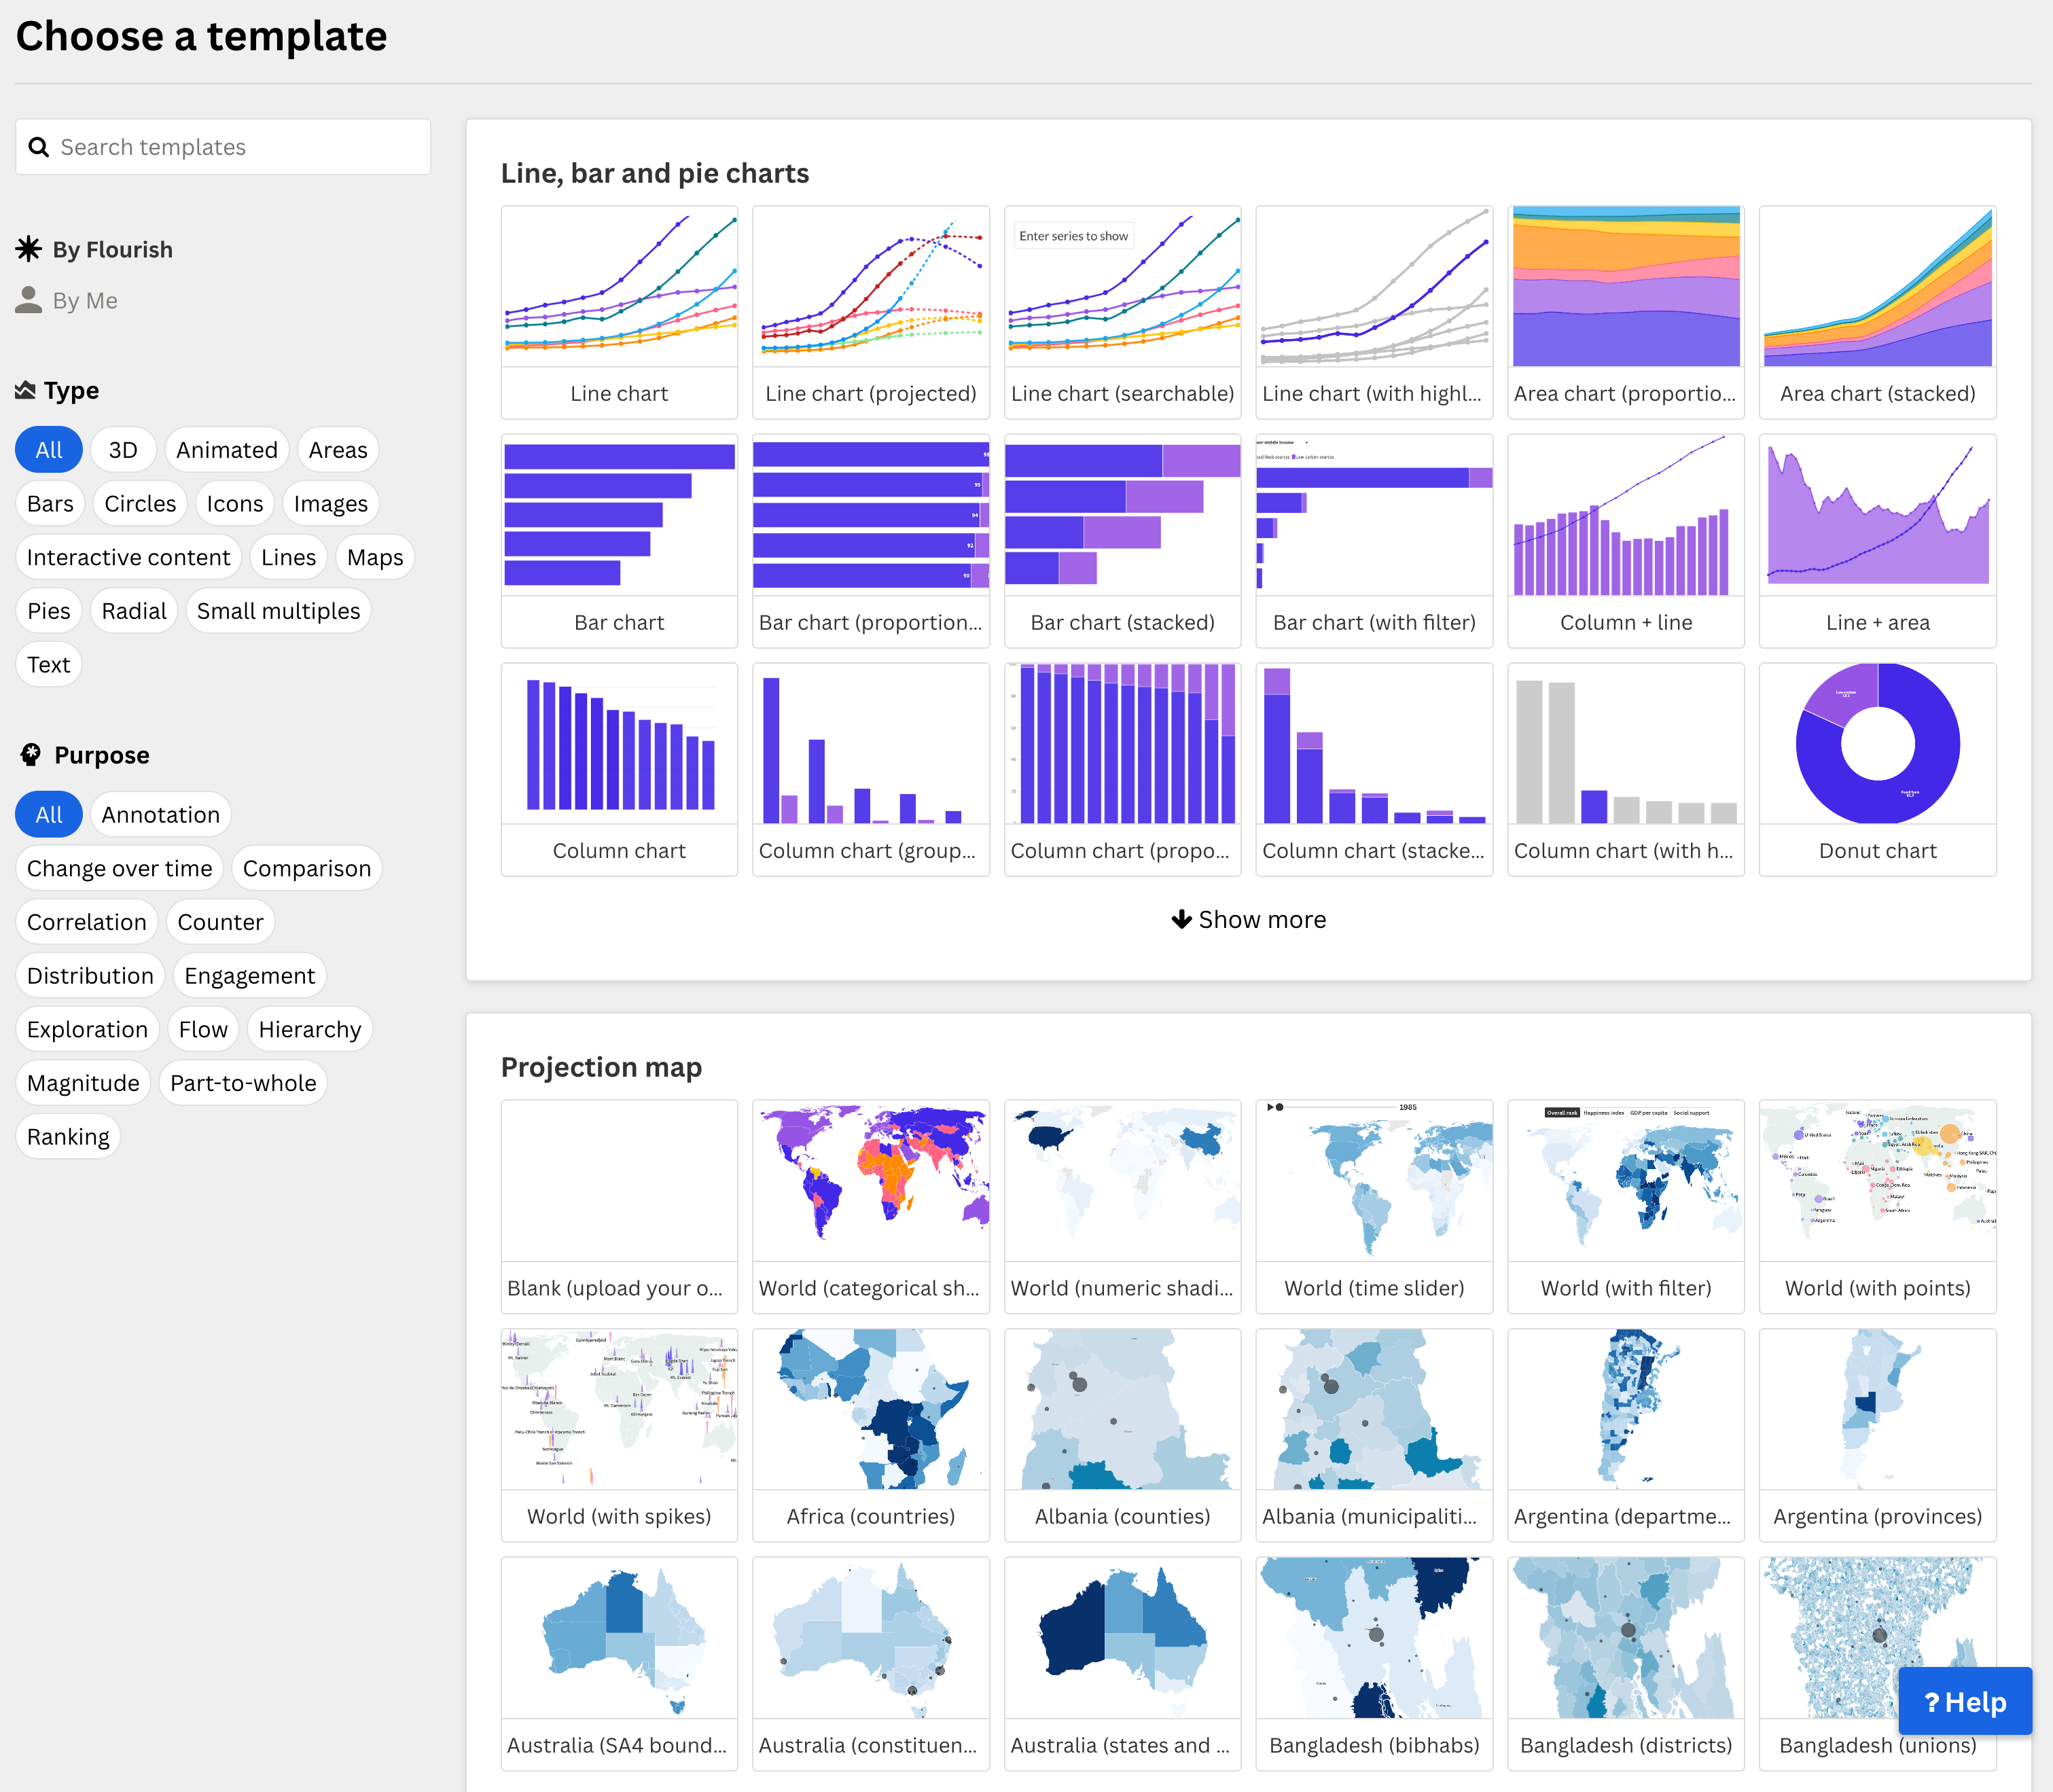
Flourish offers a wide selection of visualizations available.
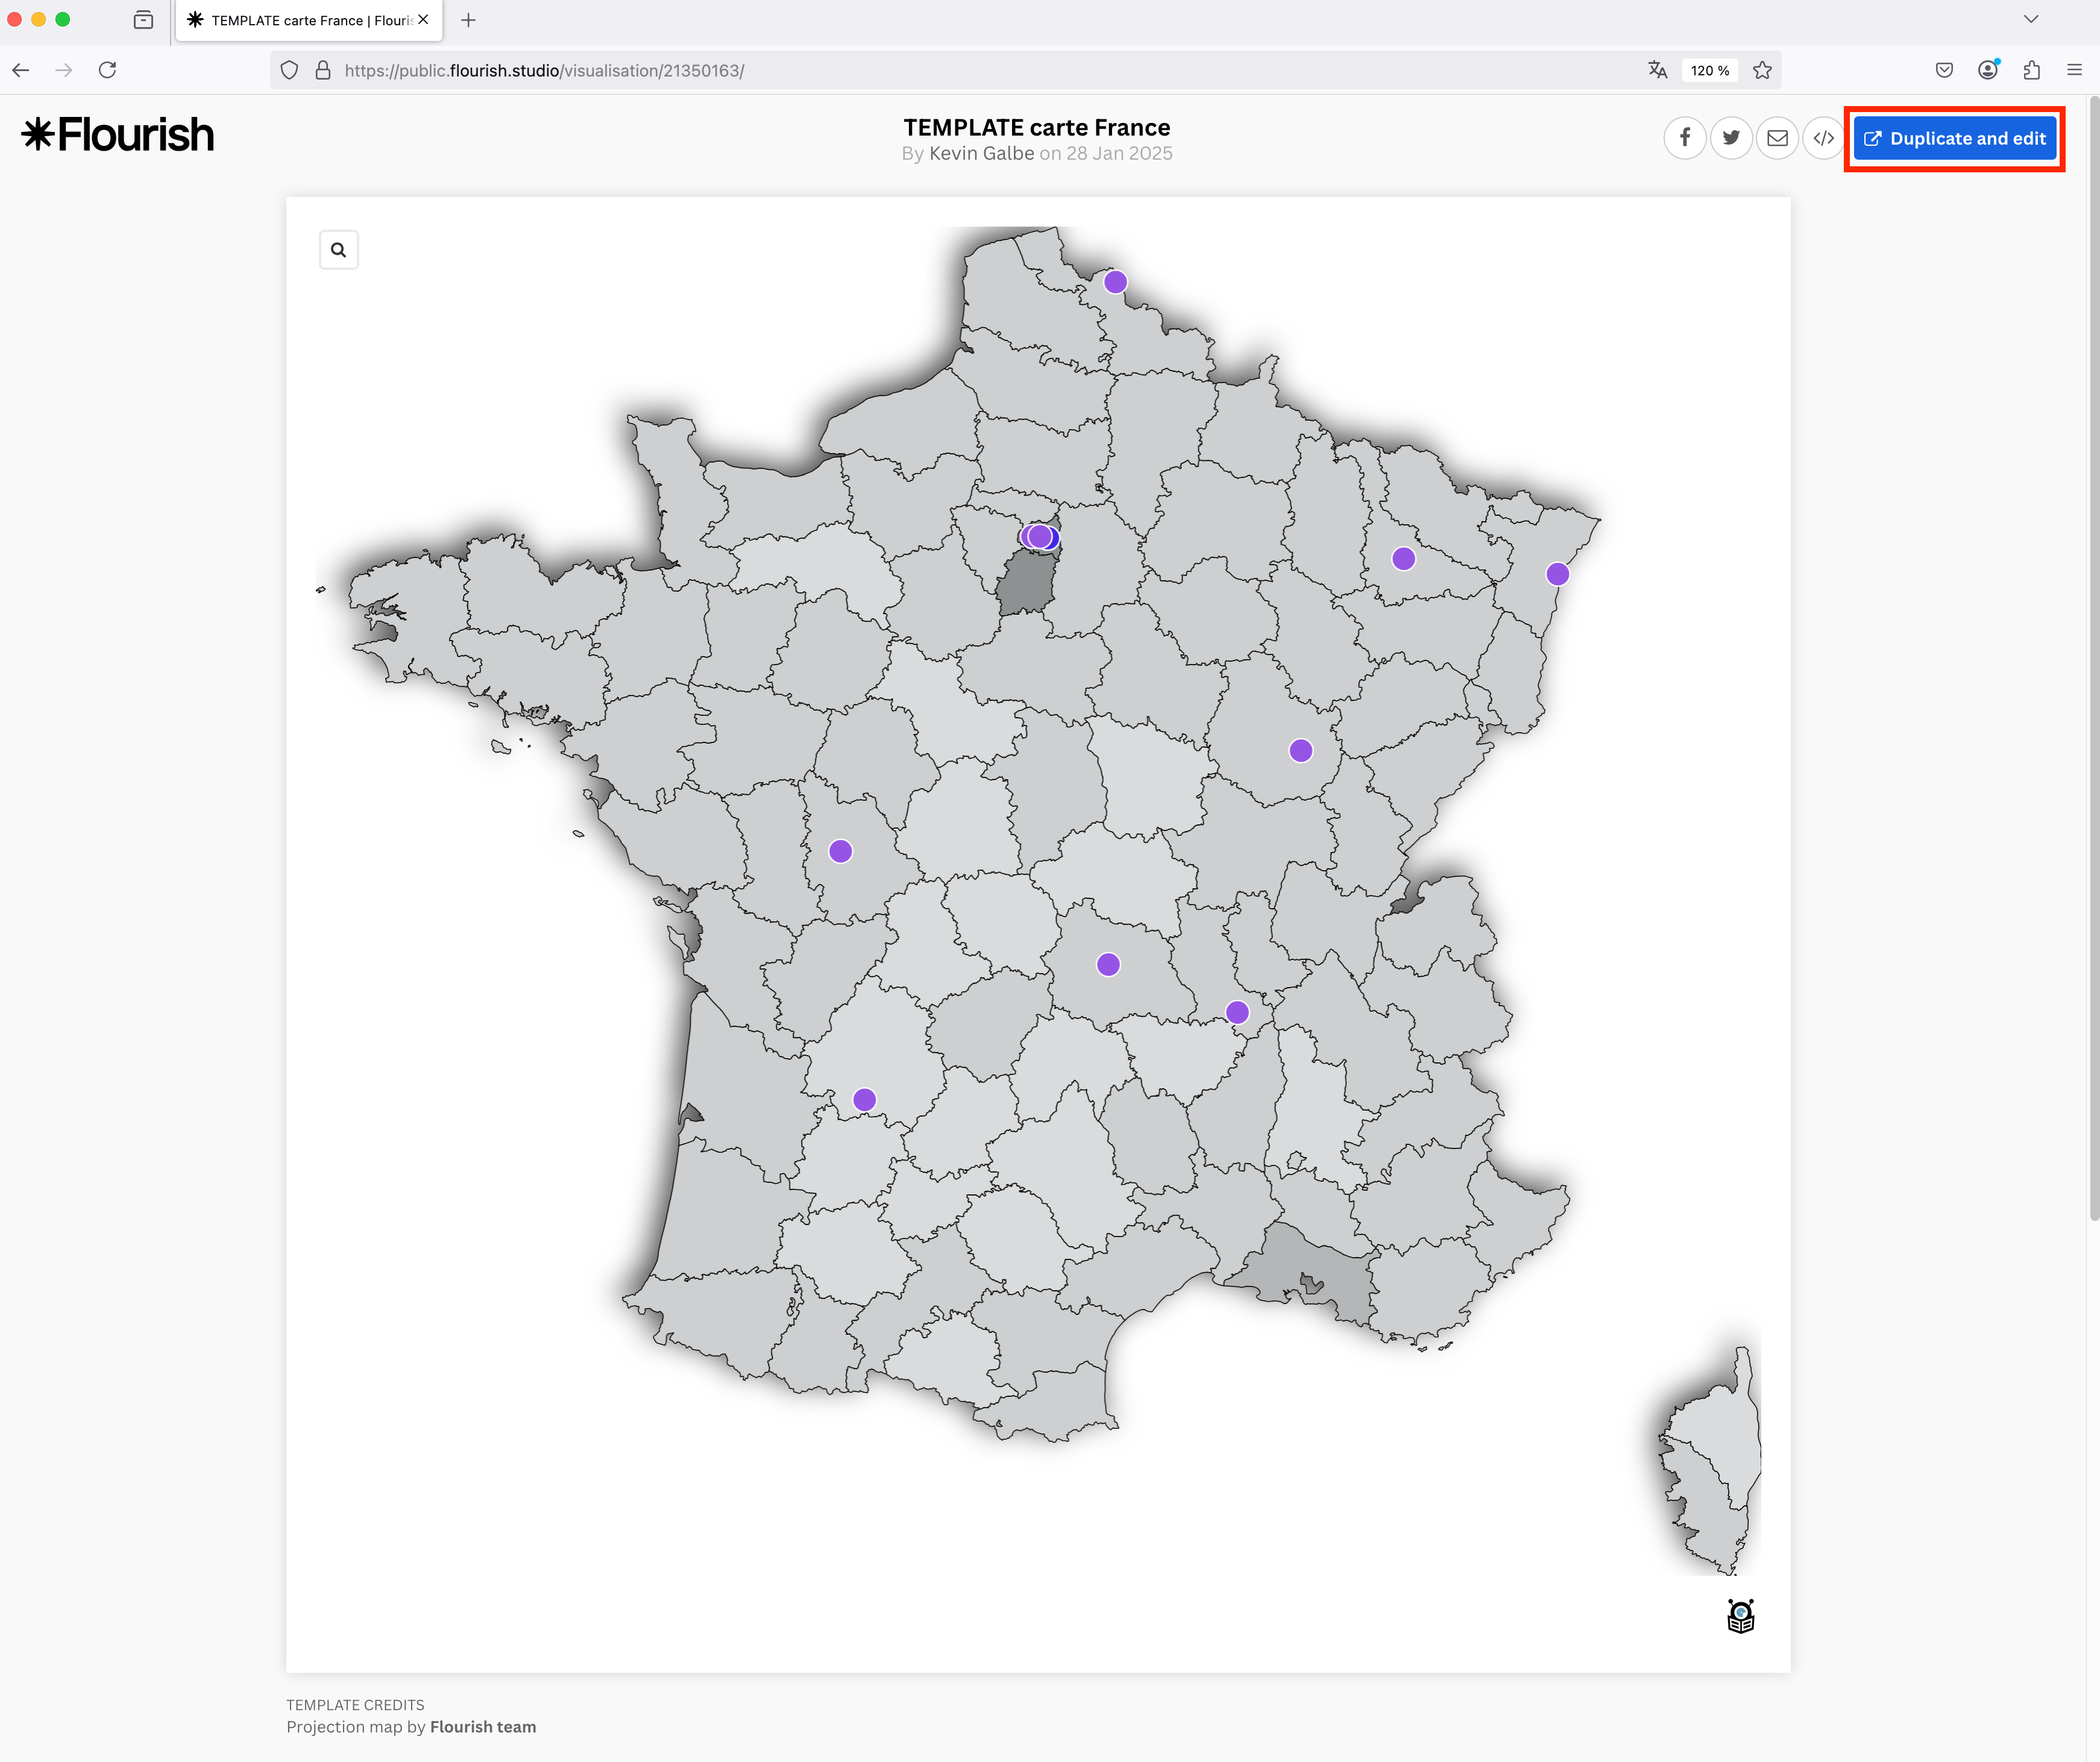
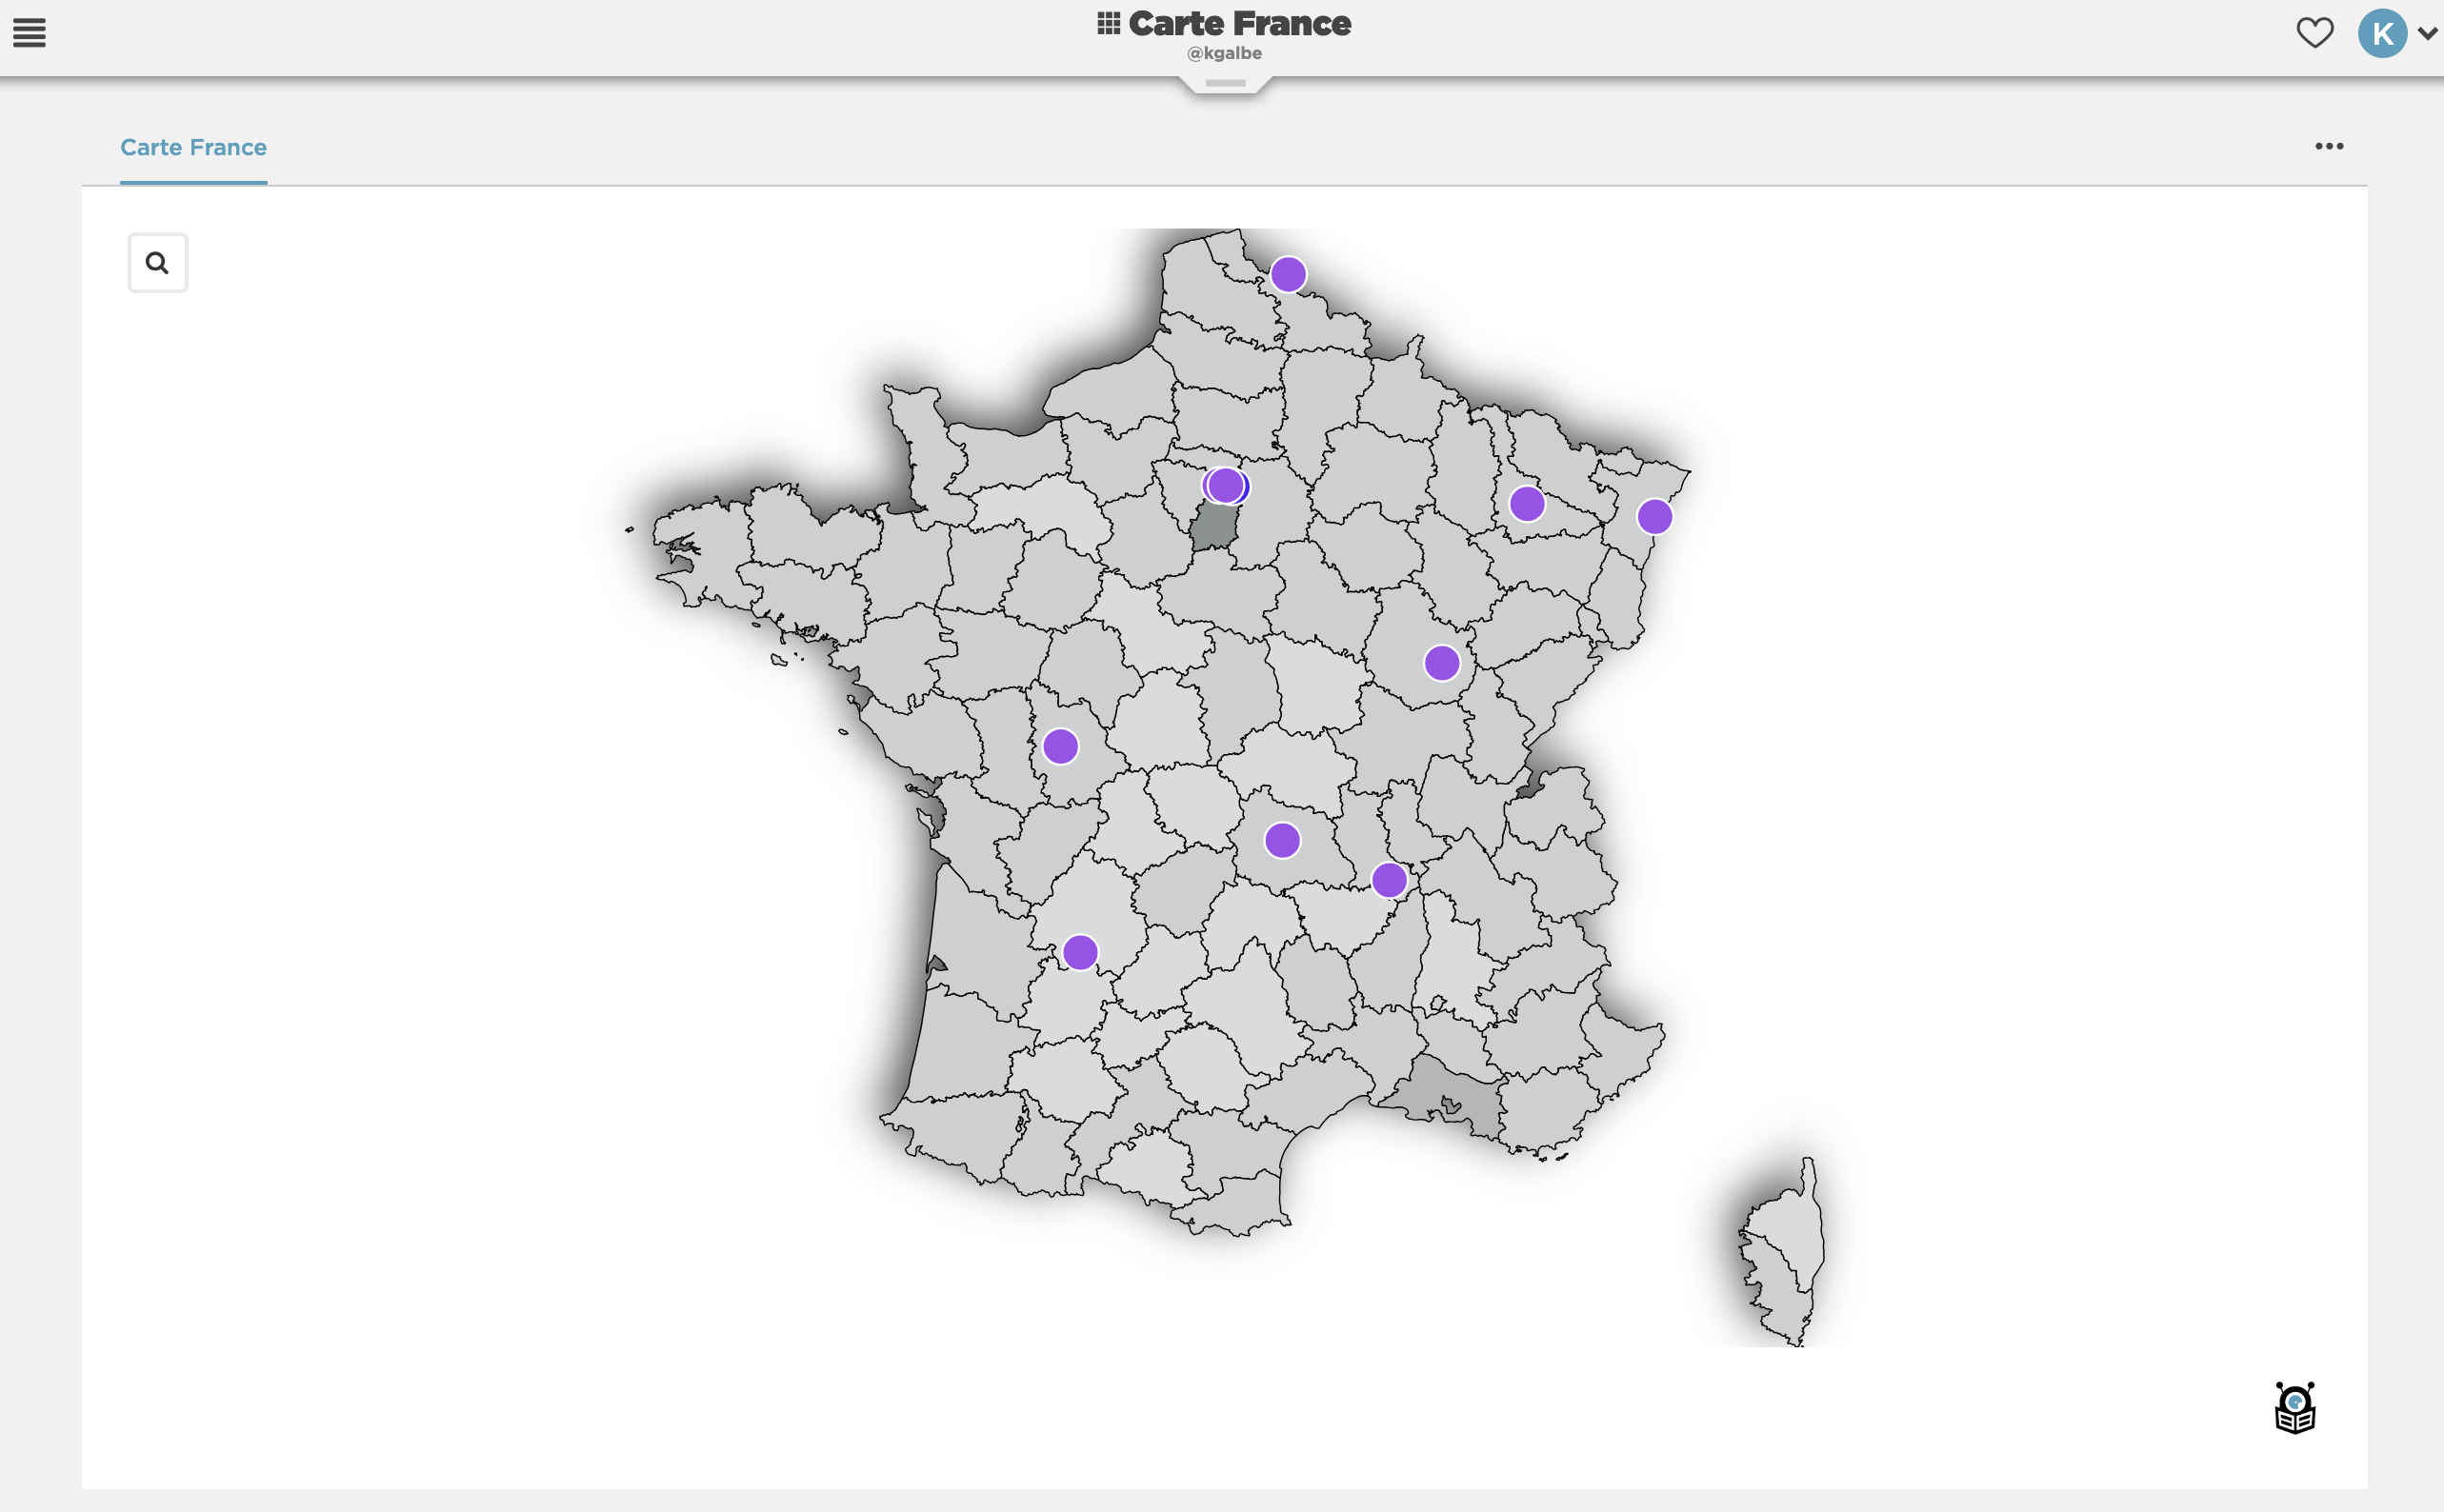
We invite you to discover two templates that you can adapt to your needs: an interactive map of the world and an interactive map of France:
To use them, simply click on "Duplicate and Edit" and create an account.
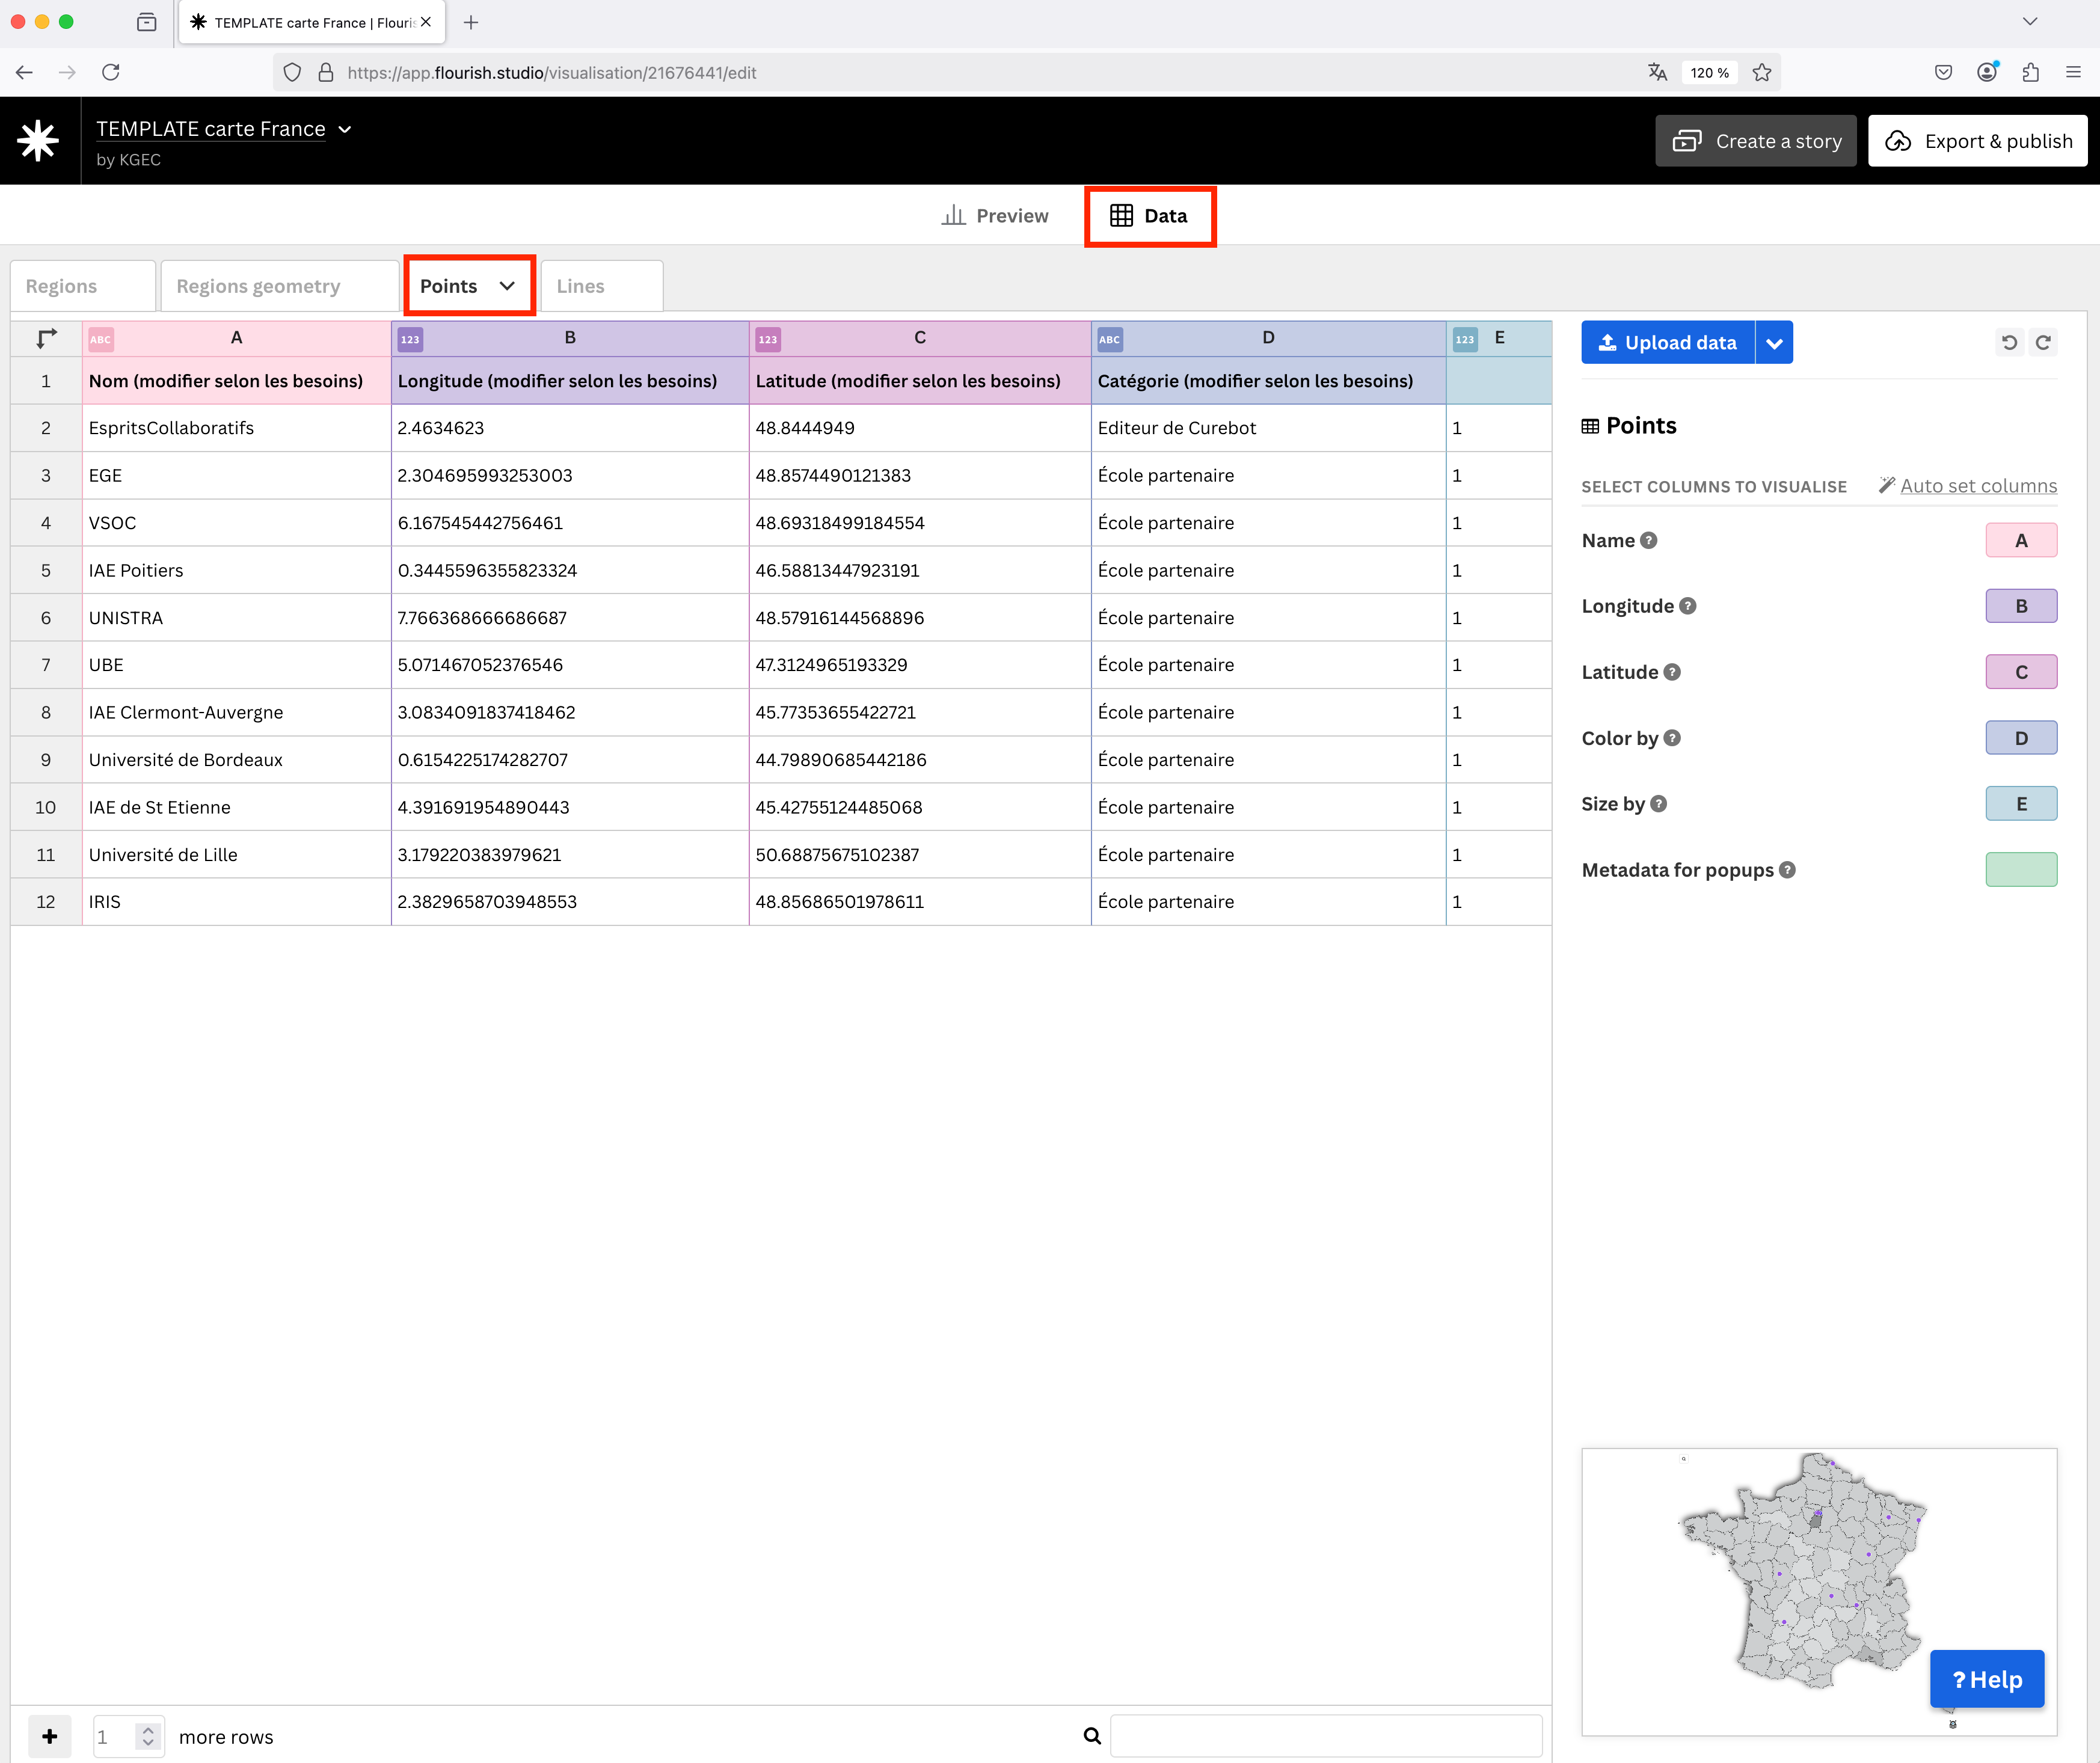
Once you have duplicated the template to your account, you will see two main tabs: the "Preview" tab and the "Data" tab.
The "Preview" tab allows you to configure all visual aspects. In the right column, you can adjust the dot colors, title, footer, map colors, and more.
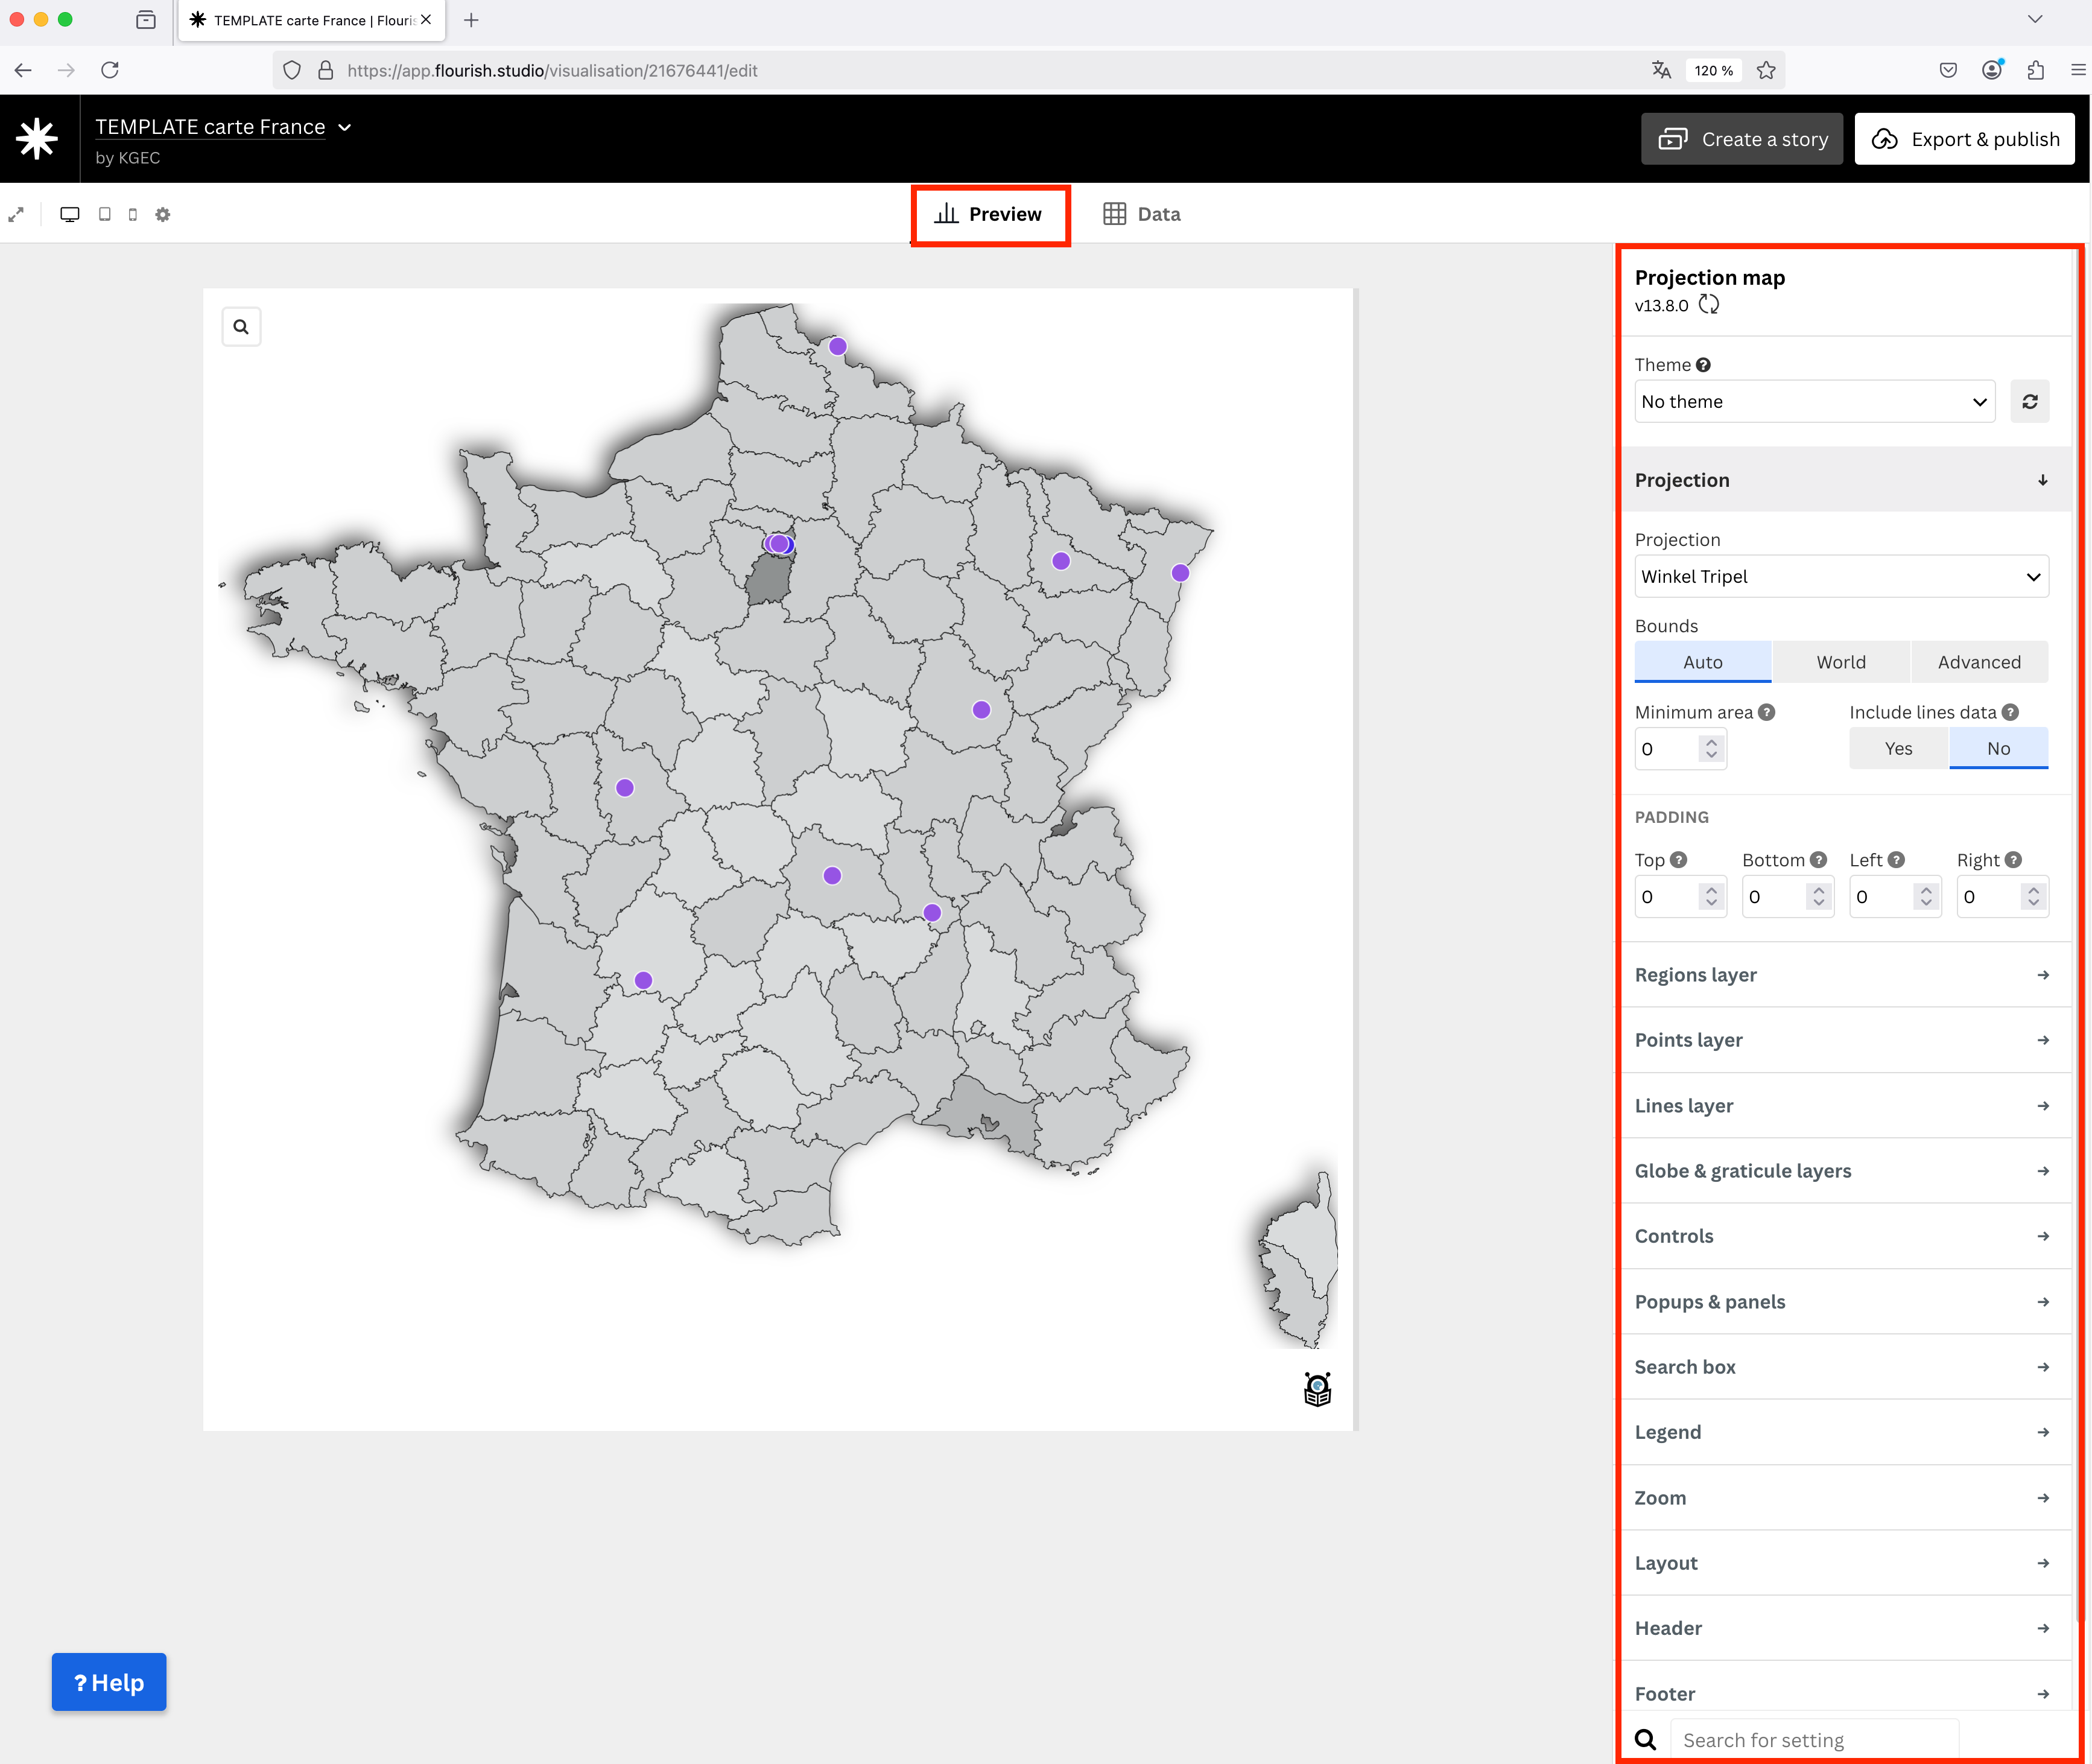
The "Data" tab allows you to enter the coordinates of the points to be displayed on the map and categorize them. You will need to add a name, longitude, latitude, and category, which will define the color of the point on the map.
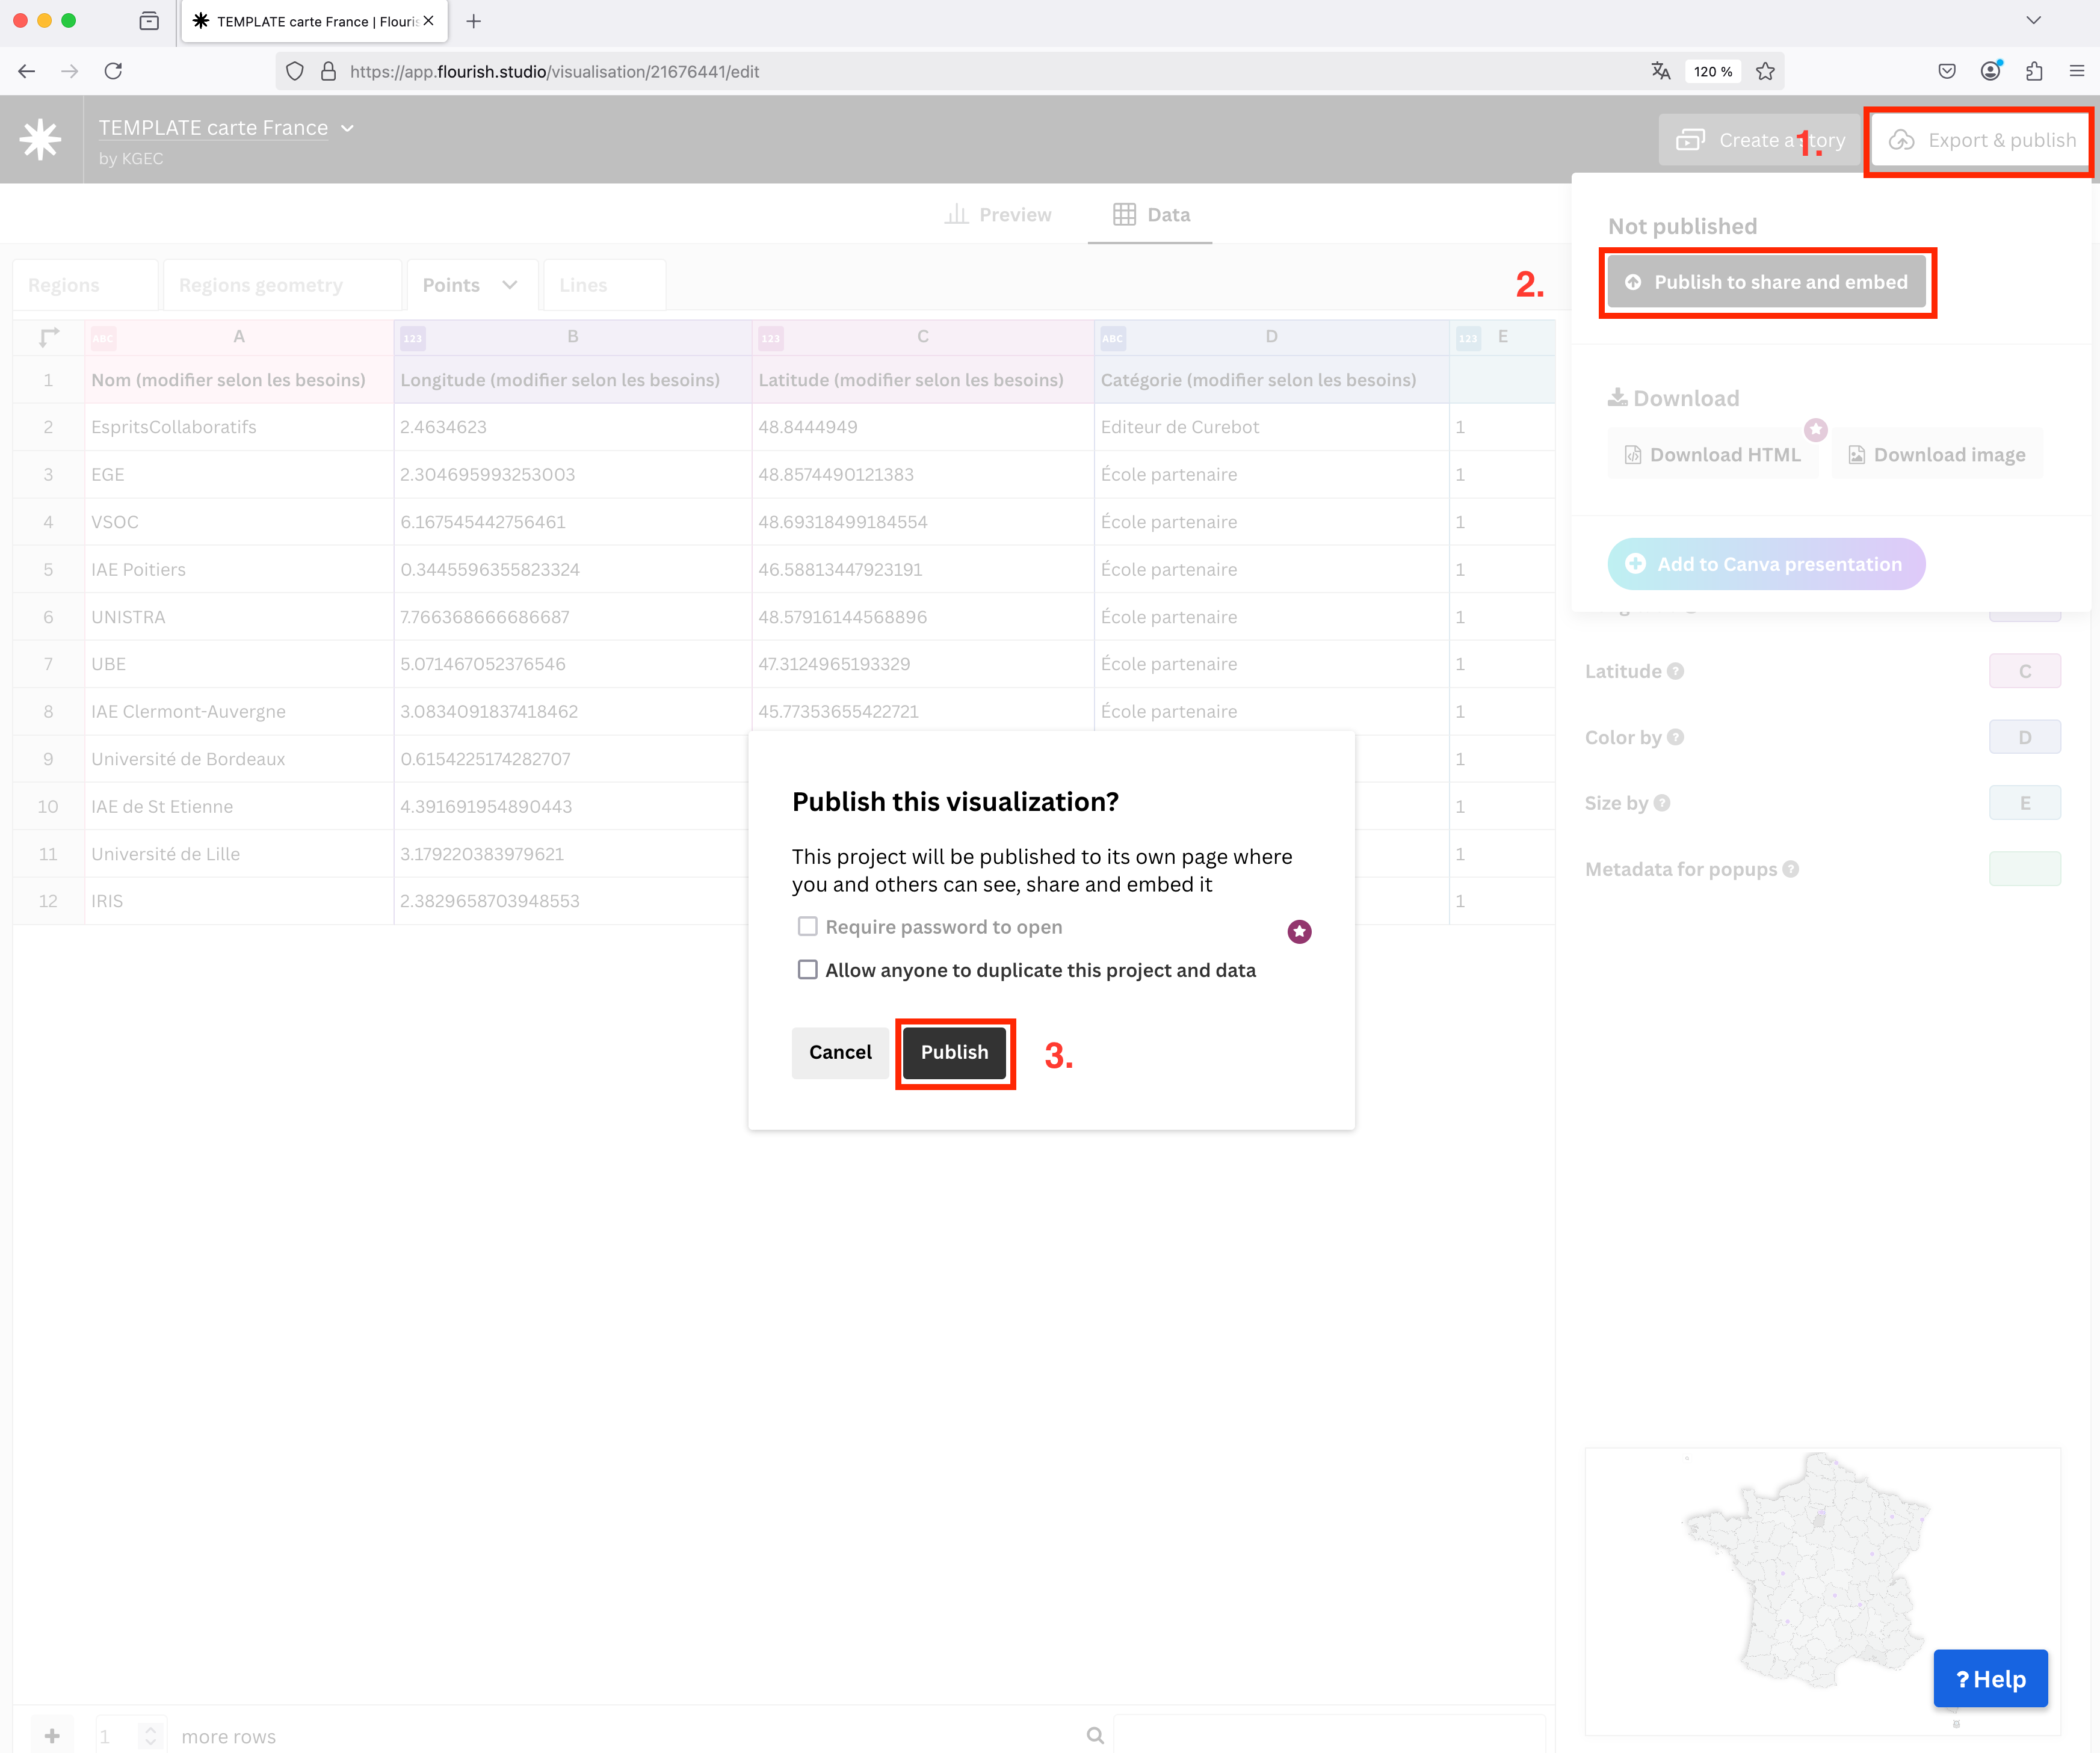
Once you've added your points and customized the visual appearance, you can create an iframe! To do this, simply click on the top right corner: "Export & Publish" → "Publish to share and embed" → "Publish".
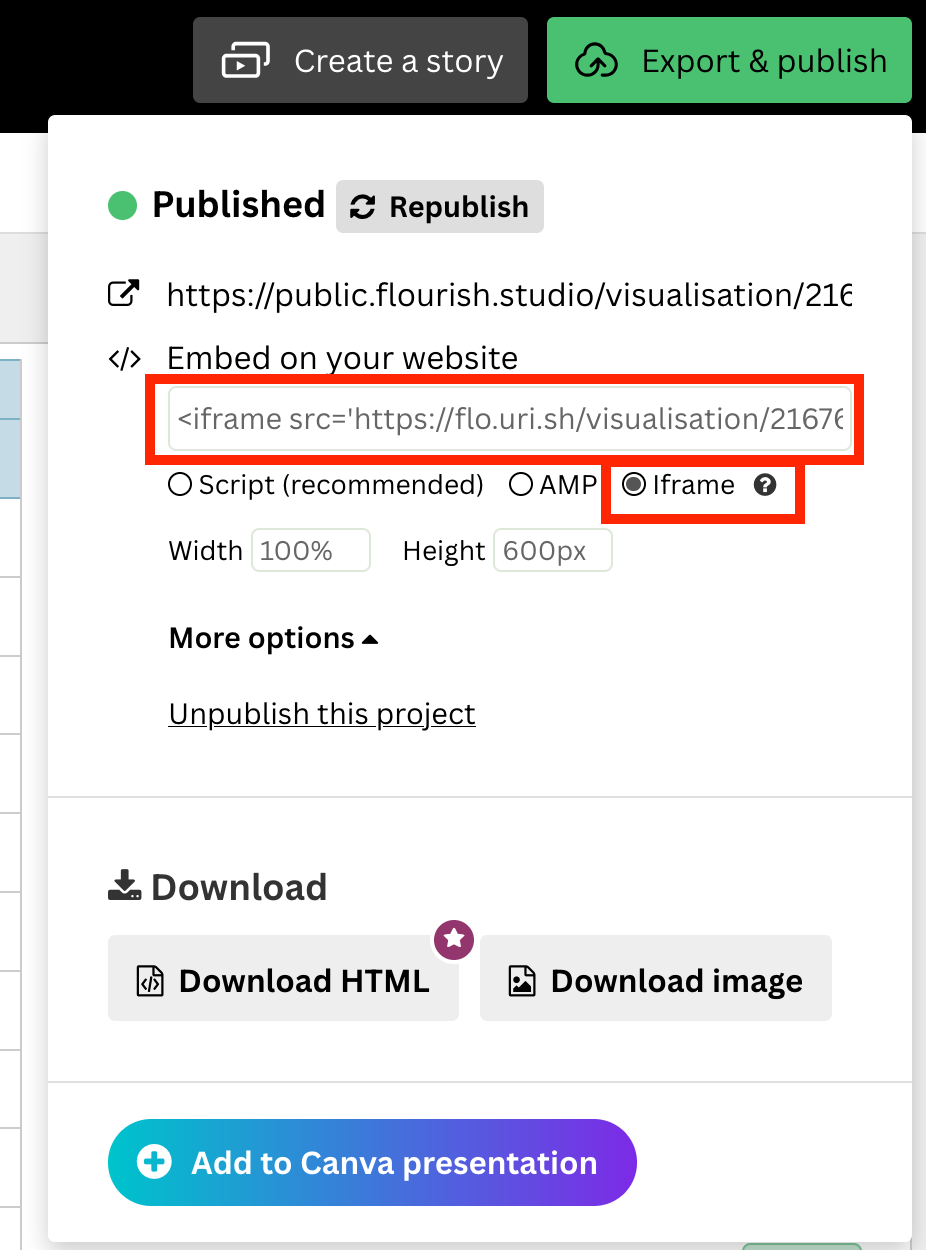
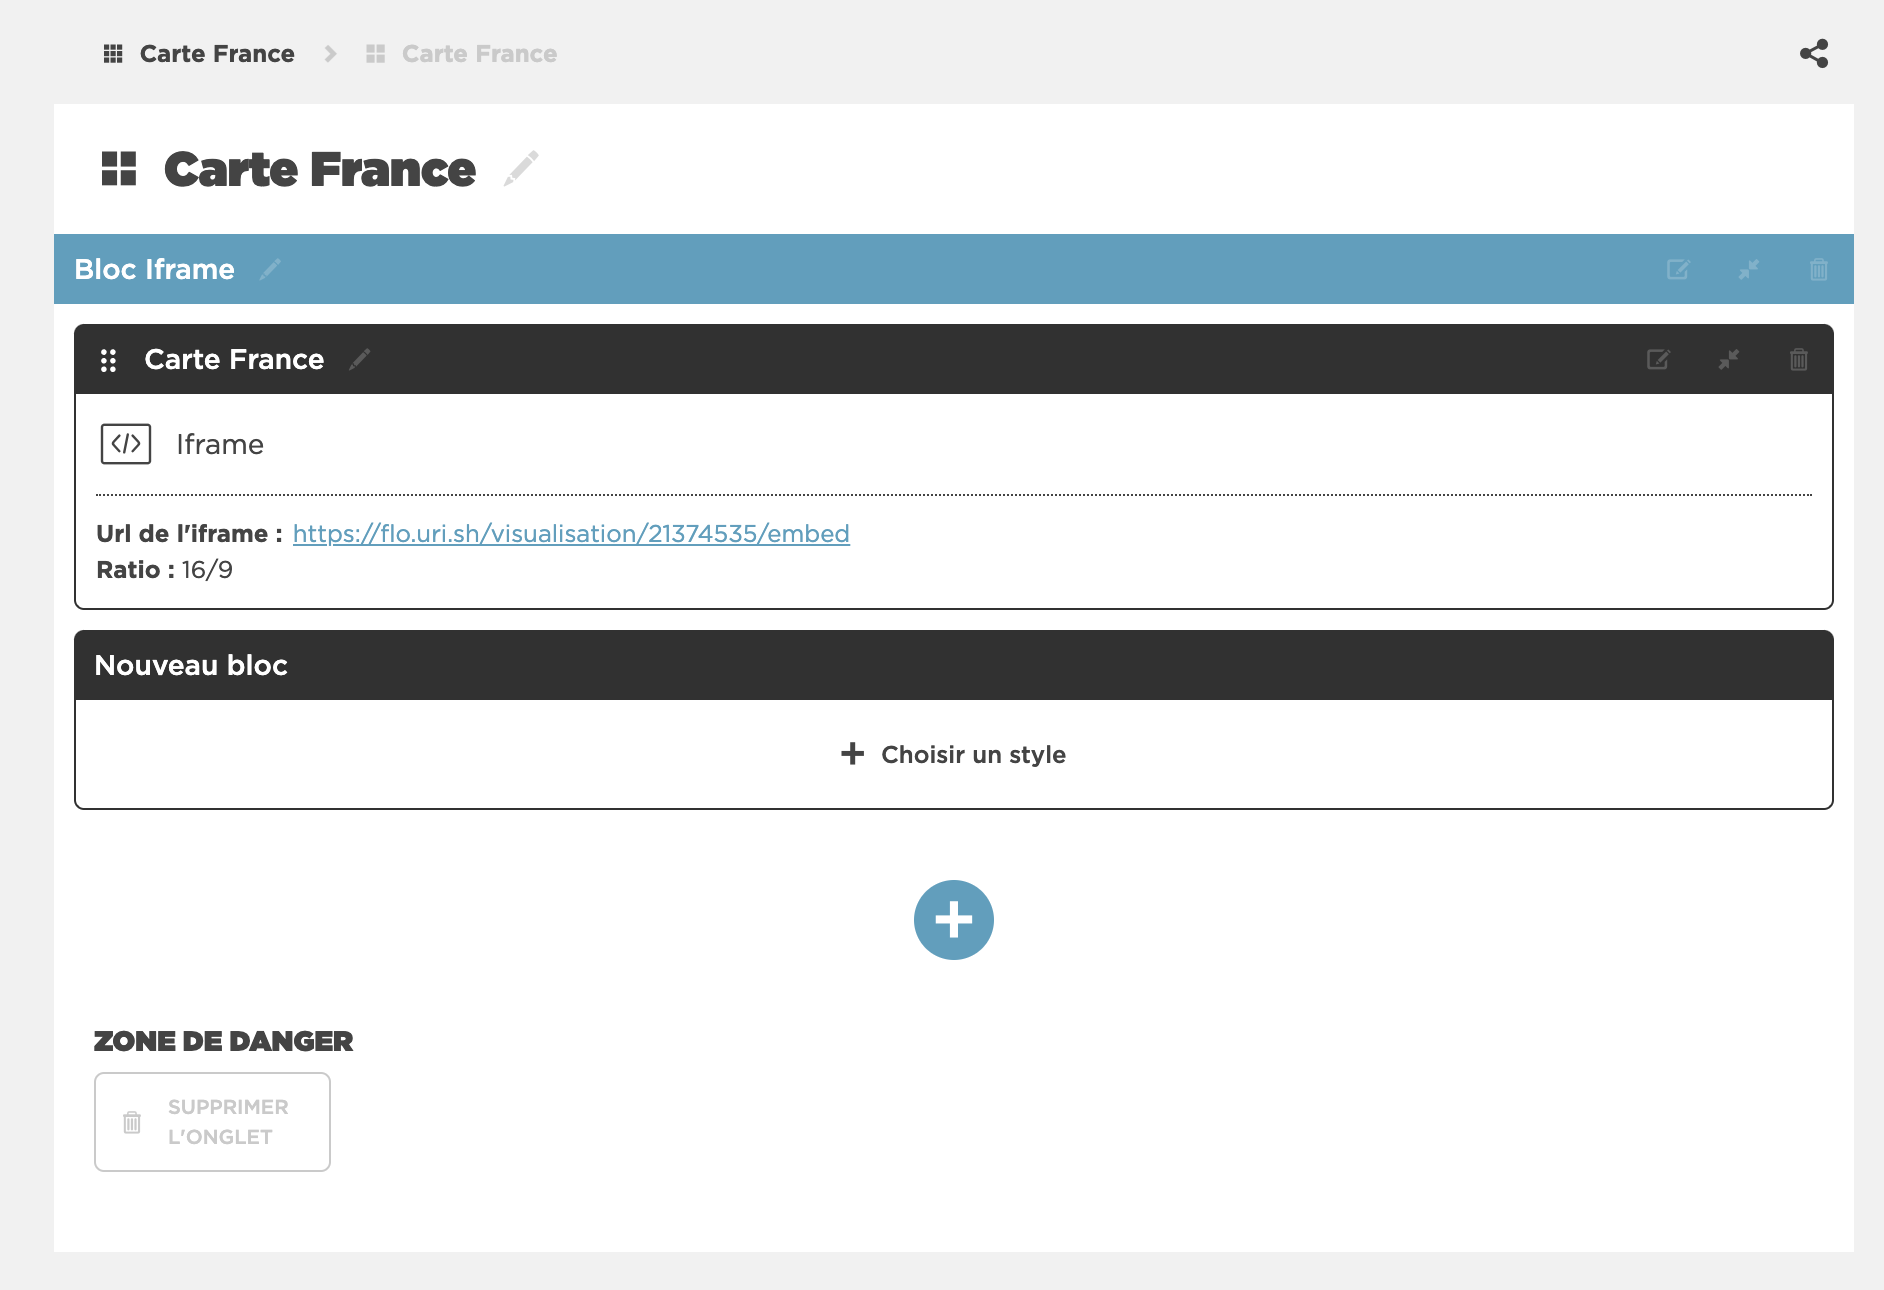
Then, click on "iframe", copy the link, and insert it into the iframe block of your Curebot dashboard!
Now that you know how to create templates on Flourish, you can customize your dashboards to make them even more interactive.
Conclusion: Maximizing the impact of your strategic market intelligence
In conclusion, the complementarity of tools is the key to effective strategic monitoring. Curebot, as a collaborative monitoring platform, stands out as a central pillar, but it is by combining it with specialized tools that you will increase the power of your analysis and communication tenfold.
Article written by: Kevin Galbe & Julien Duprat
Follow us on Linkedin